socialGraph
/socialgraph64
everything from how do networks emerge to how can I create a social graph of my Farcaster followers
How to survive this bubble?
1. Make friends, not enemies
2. Coordinate actions together.
About (1) help your friends become friends with your friends' friends. And so on => so loads of gc
But it doesn't mean that you have to be the start of the party. More the opposite.
About (2) study only looked at financial transactions. ofc we could assume that delegating or being on the same multisig is also a form of coordination.
was searching for sky scanner to check flights for the US. Didn’t pay attention and ended up here. Pretty sure I know the person
http://skyeome.net/
http://skyeome.net/
Not sure I agree with the notion that internet = dark forest. But the article is great. Talks about social networks without being too technical and argues why this super connectivity kills culture
https://www.strangeloopcanon.com/p/seeing-like-a-network
https://www.strangeloopcanon.com/p/seeing-like-a-network

Ene, one of the PhDs in my team, wrote this making the link between the technical aspect of social networks and how it influences communities
https://medium.com/togethercrew/social-networks-and-their-impact-333a2a08499c
https://medium.com/togethercrew/social-networks-and-their-impact-333a2a08499c

Listen to it this morning on my ↑run. It started with 'building the rail roads to get resources to people' & then I could only think and see social graphs.
Have to listen to it again 😅
Have to listen to it again 😅
Loading...
Did you know that you can create a social graph using pen and paper? I did a quick walk-through
https://netnigma.io/a-simple-pen-paper-tool-for-community-builders-and-network-weaver/
https://netnigma.io/a-simple-pen-paper-tool-for-community-builders-and-network-weaver/
A great article on biomimicry (how human networks can improve by coping nature) https://network.mirror.xyz/8FxbI9MROtTYg-hipN16UNxvHfBUhc7LR9TCxTzcfco

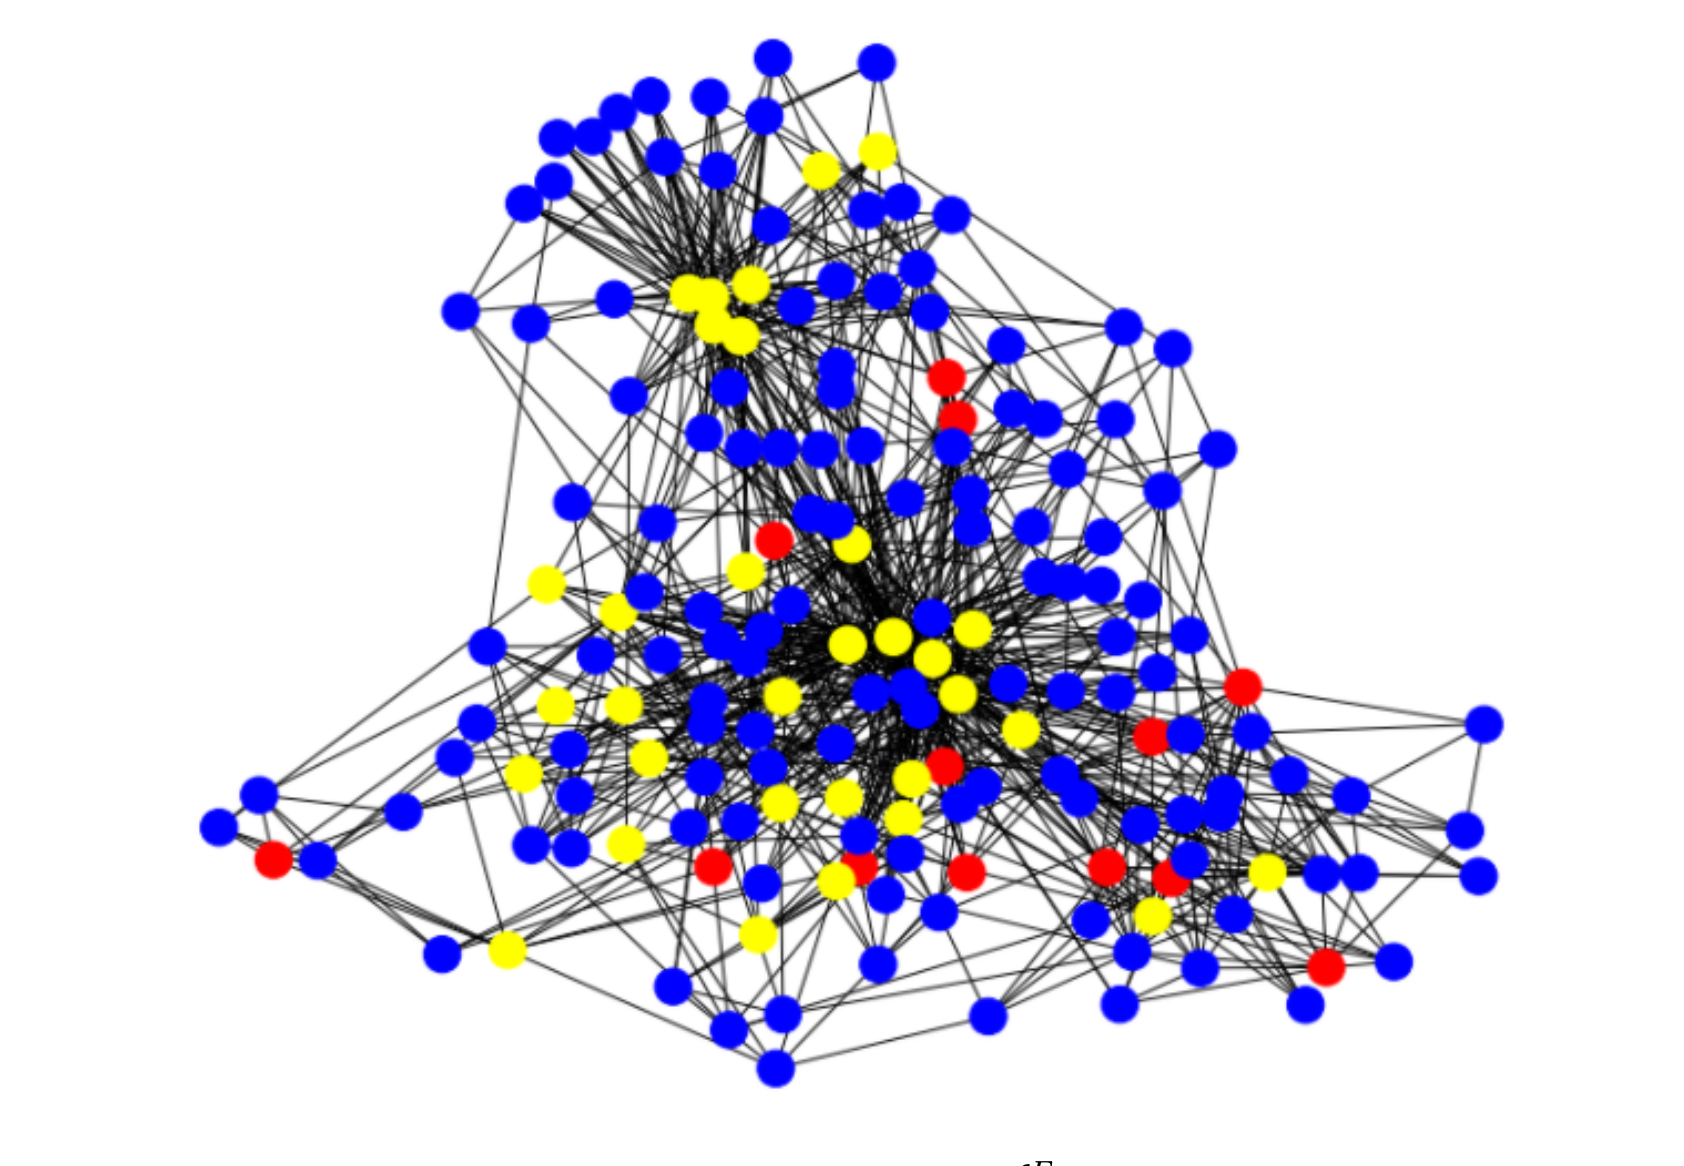
After some data cleaning (everyone needs to suffer 😈 we will discussion about which class looks healthier, helping students learn better? Which one would you rather be in?
The lines represent students who talk about the class outside of class time (e.g., self-organized peer groups, whatsapp chats etc.).
The lines represent students who talk about the class outside of class time (e.g., self-organized peer groups, whatsapp chats etc.).
Community membership via social graph visualization. The same technique is also used for fraud detection.
Loading...
Maybe I should always have a cocktail before I teach? Class went fine. We talked about social networks. I managed to explain closeness centrality without turning to math (would have been easier but less effective). People didn’t seem stressed out
One of my favorite people analytics article: https://hbr.org/2018/11/better-people-analytics
Love it for their simplicity in linking a specific pattern of communication to a goal.
You want innovation? Focus on links to other teams, also outside your company.
You want efficiency? Focus on links between team members
Love it for their simplicity in linking a specific pattern of communication to a goal.
You want innovation? Focus on links to other teams, also outside your company.
You want efficiency? Focus on links between team members

When Alex Pentland studied the communication patterns at a call center, he recommended that teams take their coffee breaks together to build their social capital. This yielded the company $15 million in productivity gains
https://ideas.ted.com/the-secret-ingredient-that-makes-some-teams-better-than-others/
https://ideas.ted.com/the-secret-ingredient-that-makes-some-teams-better-than-others/

measuring influence in a social graph by using betweeness and closeness centrality.
Come on people, let's switch it up
https://drakula.app/swipe-list?type=profile&username=kbc&postId=17a8881b-ab8e-4262-9757-1d7e562ec4bc
Come on people, let's switch it up
https://drakula.app/swipe-list?type=profile&username=kbc&postId=17a8881b-ab8e-4262-9757-1d7e562ec4bc

Social graphs are like x-rays of your community. One picture and you can see where the problems are. One problem communities experience is fragmentation.
https://drakula.app/post/7054c9c6-cb43-4c0e-af1d-ab97b9f76947?invite=mcRwzQ
https://drakula.app/post/7054c9c6-cb43-4c0e-af1d-ab97b9f76947?invite=mcRwzQ