charts
/charts255
a place for @giu to post charts
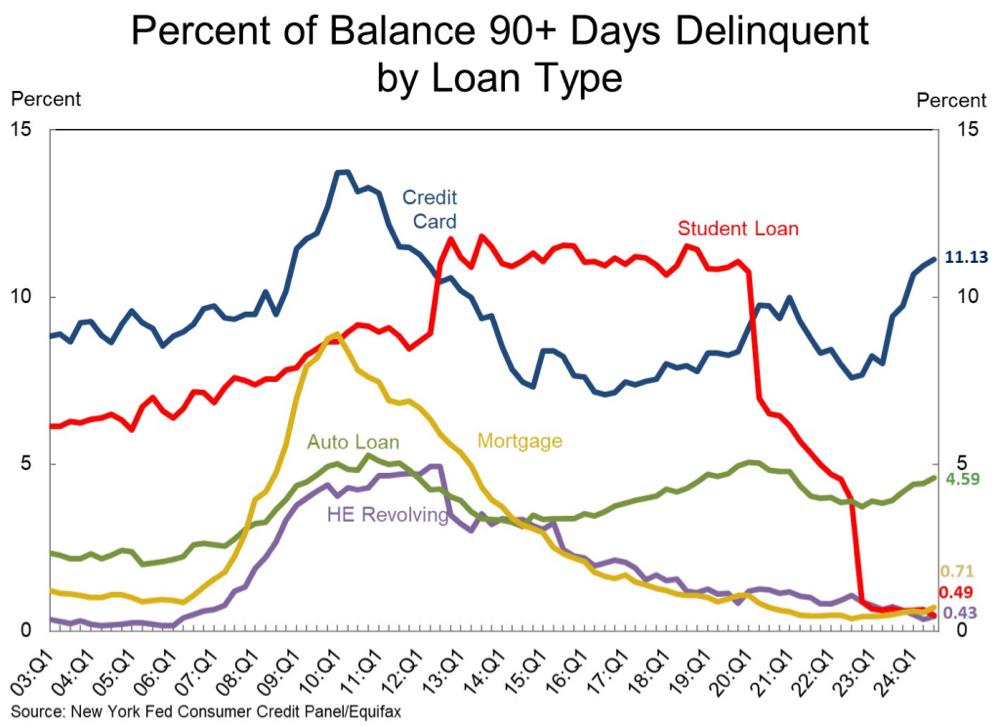
Got to be one of my favourite charts.
- Equilibrium
- Big shock
- Completely new equilibrium for no reason, except for Overton Window jumping
And now there are articles about return to office workers complaining about commutes and parking!
Status quo is a powerful thing, but everyone will forget it in 12 months
- Equilibrium
- Big shock
- Completely new equilibrium for no reason, except for Overton Window jumping
And now there are articles about return to office workers complaining about commutes and parking!
Status quo is a powerful thing, but everyone will forget it in 12 months
2013-> house prices. 1/ UK underperforming the west, 2/ Asia rekt, 3/ spot the tax haven (🇮🇪!)
This map illustrates the portion of US counties where over 25% of total income comes from government aid, 1970-2022.
Government aid accounts for 18% of household income. In 1970, it was 2%.
Real wages have been essentially flat for half a century, whilst healthcare cost has quintupled. Self-reliance is collapsing.
Government aid accounts for 18% of household income. In 1970, it was 2%.
Real wages have been essentially flat for half a century, whilst healthcare cost has quintupled. Self-reliance is collapsing.
Residential solar has a fraud problem https://www.npr.org/2024/08/14/1244330369/solar-rooftop-panels-environment-fraud-deception
Can we get the currency price charts out of this channel?
Not saying the US is likely to structurally underperform, but it may be a good time to geographically diversify if you're a long-term index investor
"Time spent outdoors is the best defense against rising rates of short-sightedness"
(and make sure you have a spare pair of glasses for the apocalypse)
https://www.nature.com/articles/d41586-024-01518-2
(and make sure you have a spare pair of glasses for the apocalypse)
https://www.nature.com/articles/d41586-024-01518-2

The Prices Paid component of ISM Manufacturing has moved up to its highest level since June 2022.
This was a leading indicator of the inflationary spike in 2021-22.
This was a leading indicator of the inflationary spike in 2021-22.